Notion Project & Task Template
A connected two-database template I designed and demoed at a campus workshop, built to teach students how relational databases work in Notion.
- Context
- Designed for a Notion Campus Leader workshop — ~40–50 undergraduate design and engineering students, fall 2024
- My role
- Ideated and designed the template; co-built it with other campus leaders; presented and live-demoed it, then supported students hands-on
- Built with
- Notion — relations, a rollup, a formula, filtered and grouped views, charts, and database templates
- Status
- Distributed to workshop attendees; extended afterward
The idea
As a Notion Campus Leader — a role you apply for, with a small cohort per campus — I helped run events to get students using Notion. For a fall 2024 workshop with ~40–50 design and engineering undergrads, I designed a template to teach one specific idea: how relational databases work.
A project-and-task tracker was the vehicle — familiar enough that students immediately got the point, and a natural way to show two databases linked together rather than one long list.
What it is
Two connected databases:
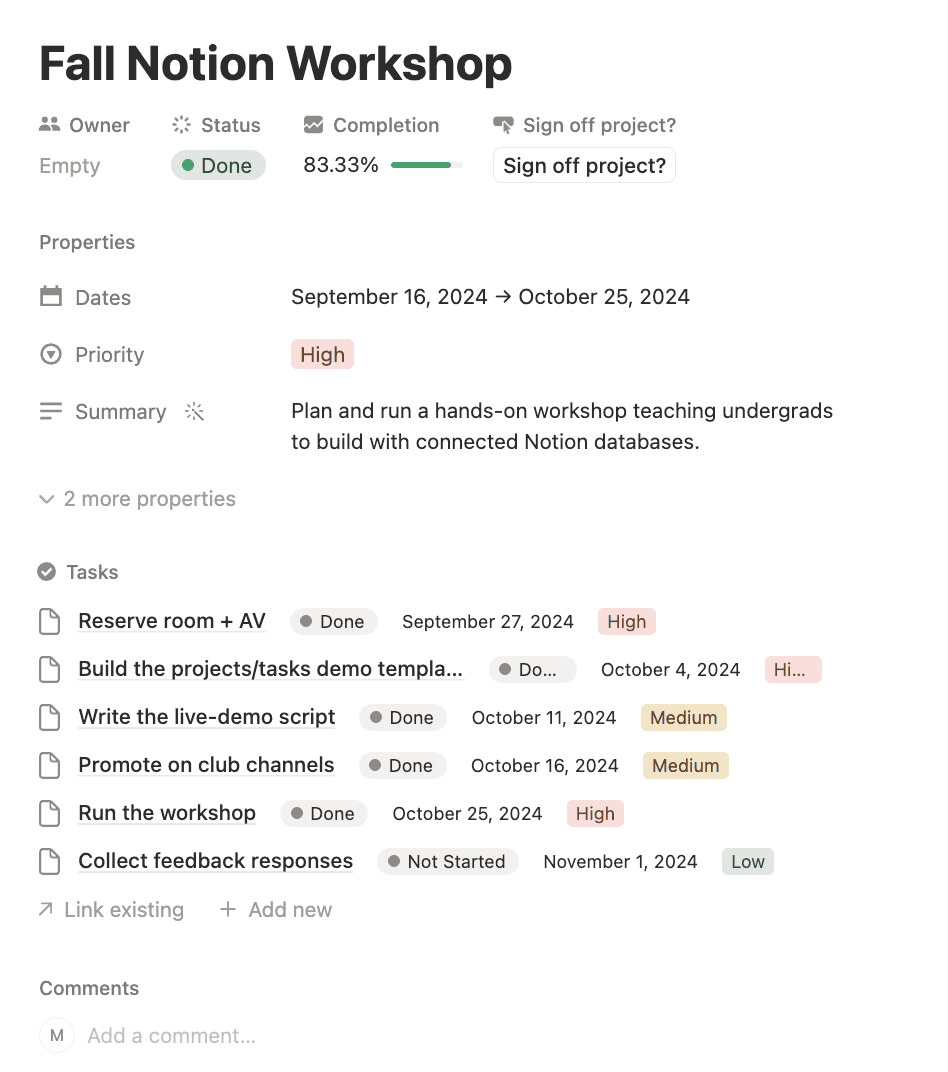
- Projects — one row per initiative, with status, priority, a date range, and a rollup showing what percentage of its tasks are done.
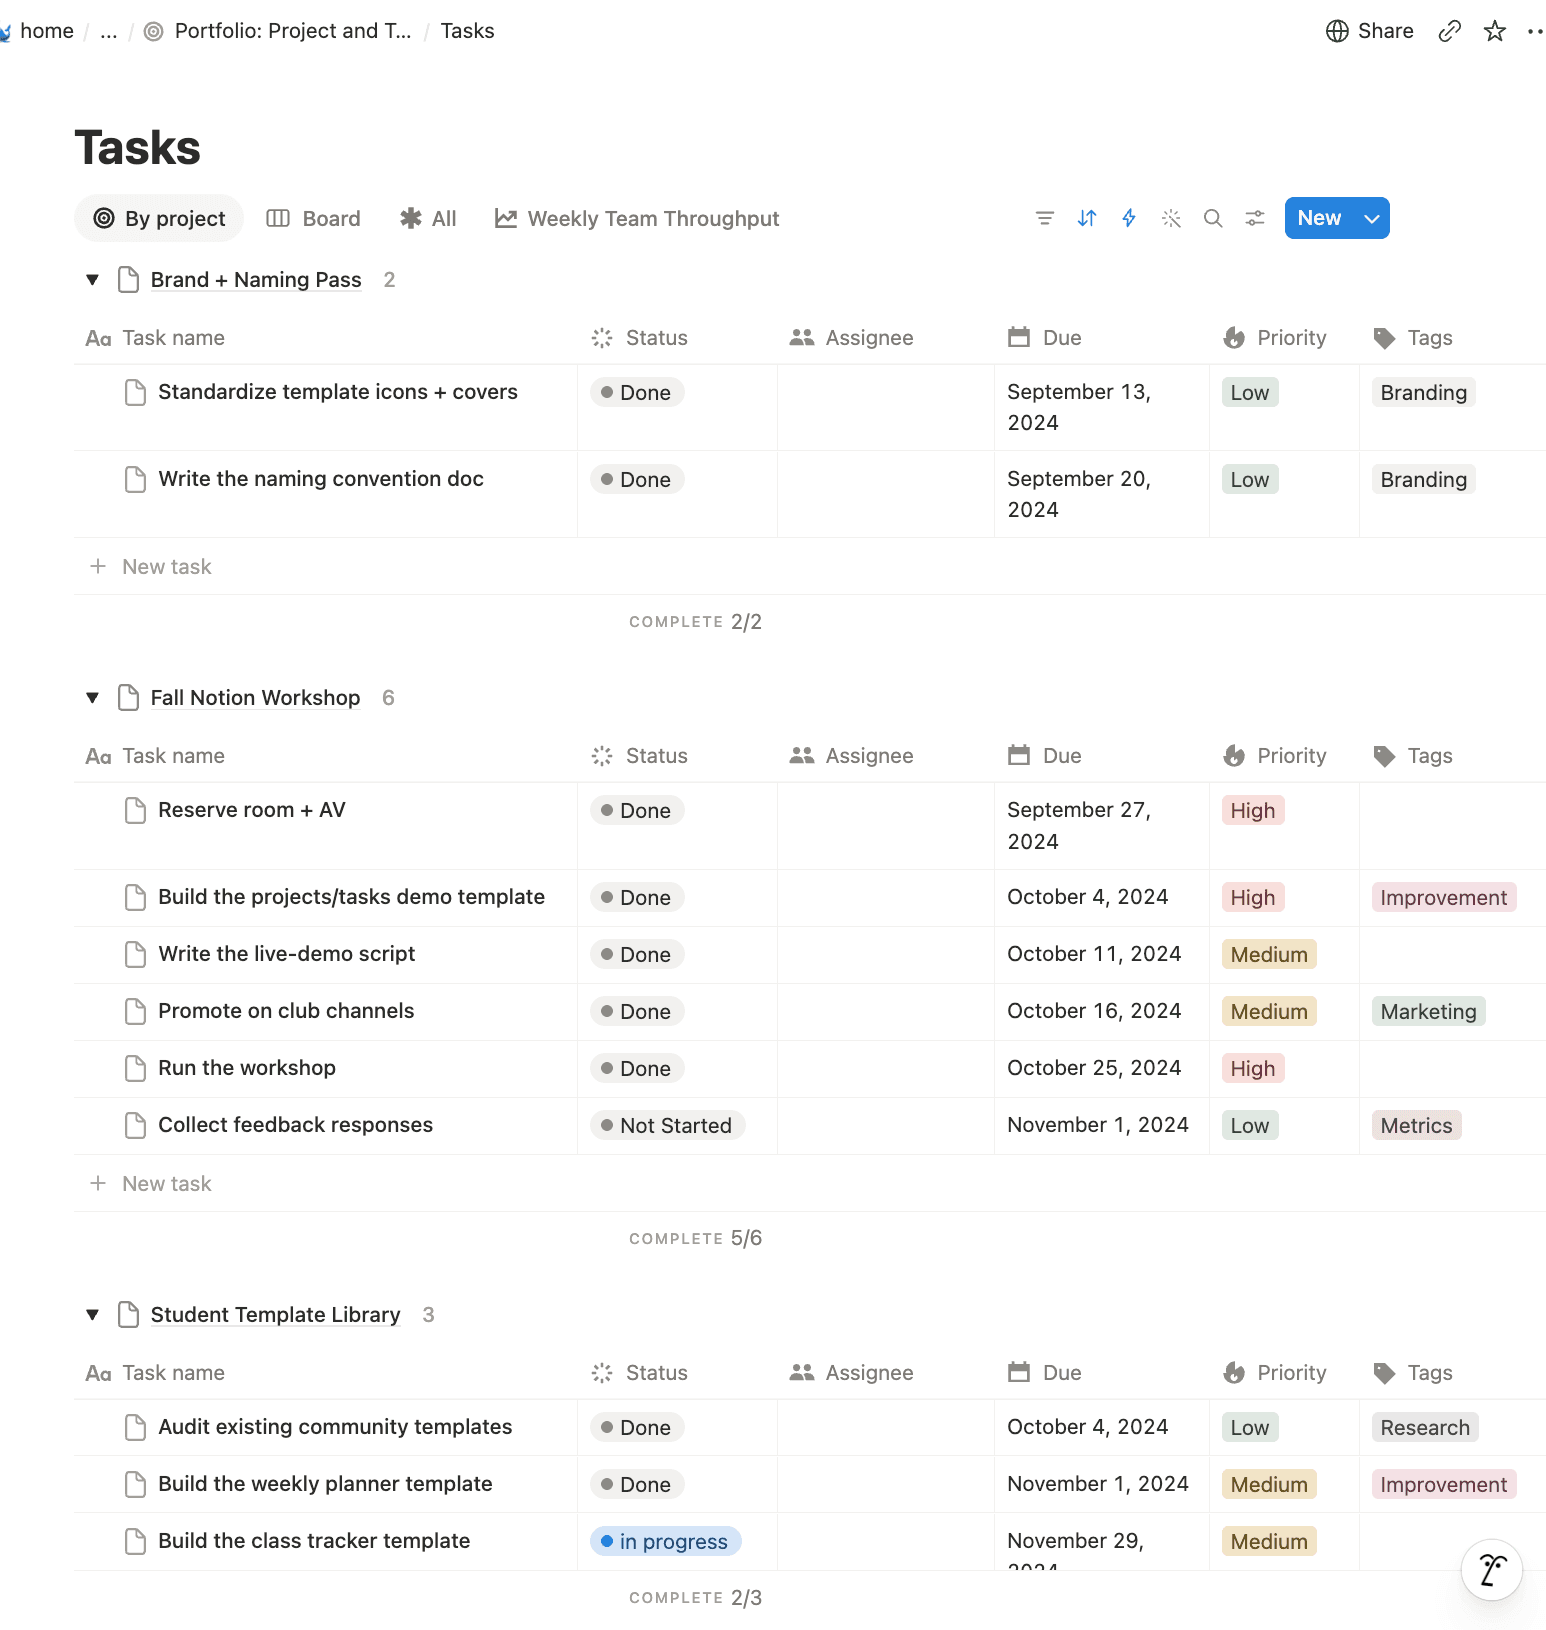
- Tasks — one row per task, each linked to a project through a relation, with due dates, priority, and tags.
The teaching moment is the link: change a task's status and the project's completion bar moves on its own. Grouped and filtered views show the same records organized different ways — by project, or on a single project's page — without duplicating anything.
Kept it a wireframe
Students got a deliberately minimal version — two databases, the relation, a rollup, and a few views. Automations were left in the template but switched off, so anyone could turn one on and extend it rather than reverse-engineer it. The point was for the database concept to stick, not to show off every property Notion offers.
How I extended it
Afterward I built my own copy out further, to see how far the pattern goes:
- A Delay formula (
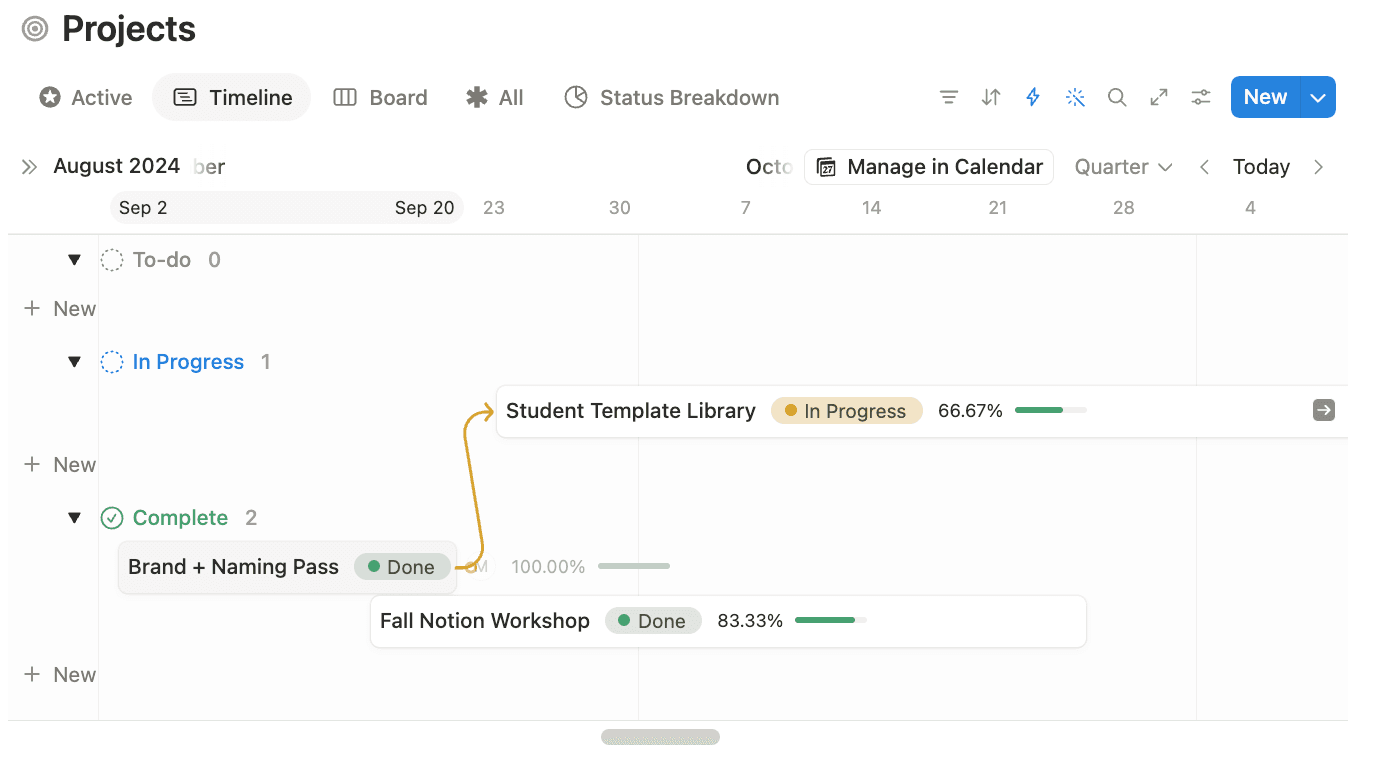
dateBetweenon the due and completed dates) flagging how late each task ran. - Project-to-project dependencies (Blocked By / Is Blocking), shown on a timeline.
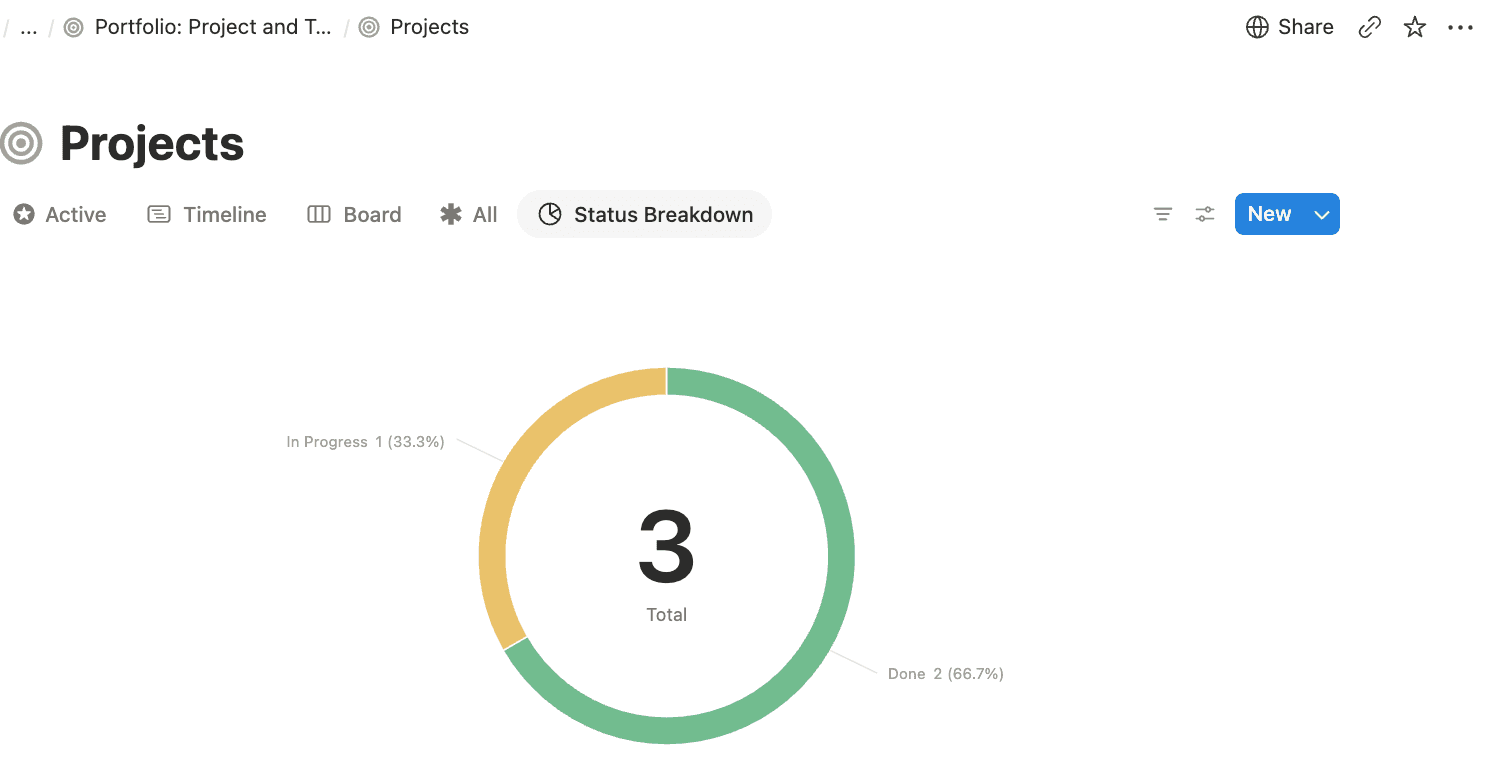
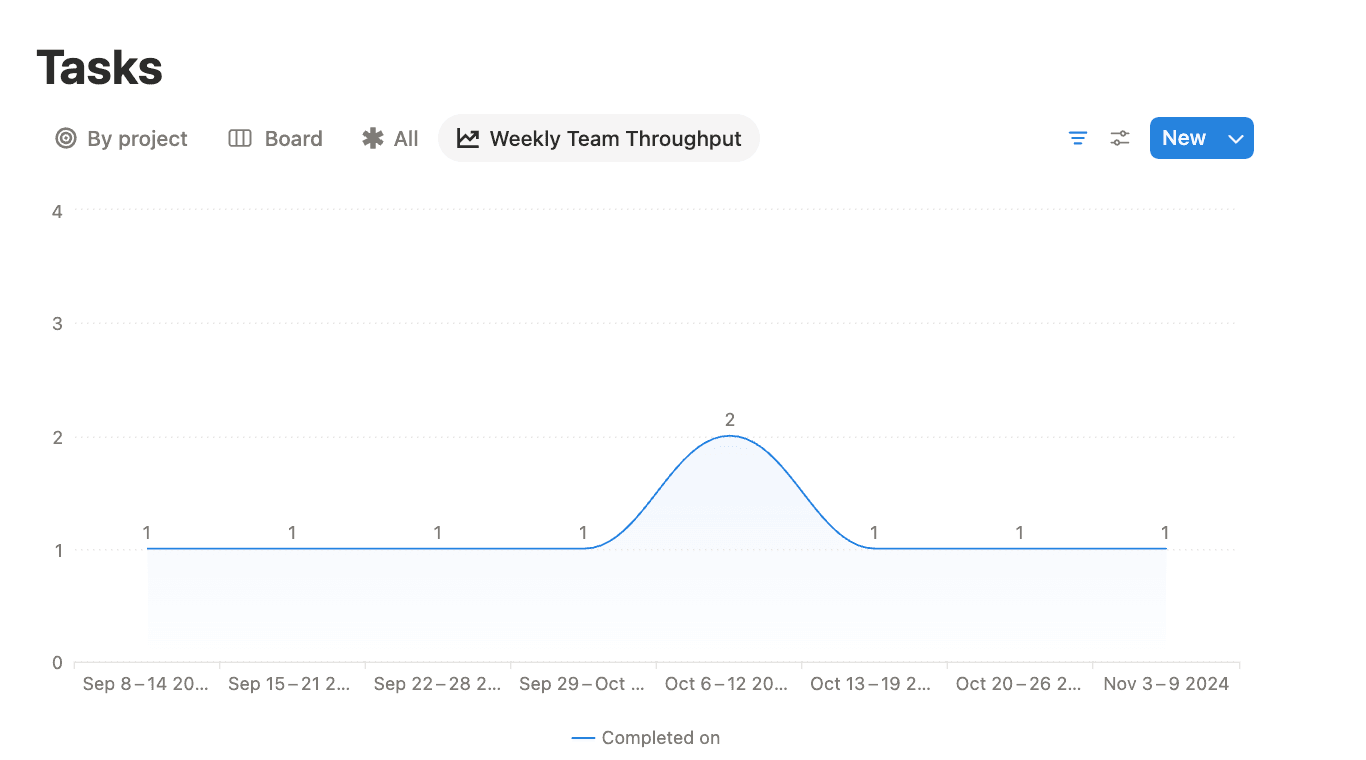
- Charts — a status breakdown, and weekly throughput of completed tasks.
What I'd do differently
Simpler categorization. Multiple task lists per project got noisy fast — a project needs one clear list, not five.
And I'd orient it around individual progress. The template leans on an assignee / team model, but in my own use I was the assignee on nearly everything. It was really a personal task board, and it would've been more useful built that way from the start.
What I took from it
Designing something for beginners forces you to be clear about what actually matters — the relation and the rollup, not the fifteen properties you could add.
And there's a real skill in sizing a task: a line item that's genuinely trackable versus one so granular it's just noise.